
RHR Summary Data
This page includes IMPROVE data summaries and calculated values, such as light extinction and deciview. All Data aggregations, calculated variables and patched values in the daily values data sets were generated using the procedures from the Guidance for Tracking Progress Under the Regional Haze Rule.
Data Updates: If you would like to receive a notice when RHR data are updated, contact: anthony_prenni@nps.gov
Data Format Description: Microsoft Excel file describing the columns and general format of the summary files below. This description includes the parameter names used in the ASCII files with their associated parameter names in the integrated database. It also includes descriptions of the units and calculation algorithms used. Variable lists for the daily values for RHR2 and Impairment are also included here:
Daily Impairment Variable List (Updated August 2022)
Class I areas and representative sites
UPDATES
Summary of updates to IMPROVE RHR Metric Data since October 2019 (UPDATED January 2026)
From December 2019 through December 2020, the RHR dataset was updated to allow for up to two patched values per day, as described in the Data Patching description; other changes were also implemented. These changes potentially impacted data at every site for the entire data record including natural conditions, 2064 endpoints and RHR2 and impairment metrics.
Natural Haze Levels II
Using the Second IMPROVE Algorithm:
Natural Conditions II Updated September 2025
Natural Conditions II Updated December 2022
Natural Conditions II Updated April 2020
Natural Conditions II Updated December 2019.
Natural Haze Levels II (version 2, includes substituted data):
This file contains the second version of the natural haze level II estimates based on the work of the Natural Haze Levels II Committee. A description of the procedures for estimating these values can be found here. These data fix a minor error in the first version of the natural haze level II estimates. The first version of these data did not include values for monitoring sites with less than three complete years of monitoring data. States have provided substituted data for missing data values at these sites that represent haze in class I areas. For these sites the natural haze levels are estimated using only the measured data and using measured data and substituted data values.
Natural Haze Levels II (version 1):
This file contains the first version of the natural haze levels II data. These data contain known errors and should not be used. These data are provided to maintain lineage and consistency with past analyses.
2064 Endpoint File
2064 Endpoint Updated September 2025
2064 Endpoint Updated October 2023
2064 Endpoint Updated December 2022
2064 Endpoint Updated April 2020
2064 Endpoint Updated December 2019
2064 Endpoints. This file contains the 2064 endpoint values.
Regional Haze Rule Summary data through 1988 – 2024 (September 2025)
Using the Second IMPROVE Algorithm:
Means for Best, Middle, and Worst 20% Visibility Days:
CSV file with the means of the best 20% visibility days (G10), middle 20% visibility days (G50) and worst 20% visibility days (G90).
Daily Values Including Patched Values:
CSV file with the daily IMPROVE species mass concentrations and calculated aerosol mass and light extinction values. Also included are the patched values where applicable. (zipped file)
Means for Impairment Metric:
CSV file with the means of the 20% least impaired days (G10), middle 20% impairment days (G50) and 20% most impaired days (G90).
Daily Impairment Values Including Patched Values:
CSV file with the daily IMPROVE species mass concentrations, calculated aerosol mass, light extinction values, and impairment parameters. Also included are the patched values where applicable. (zipped file)
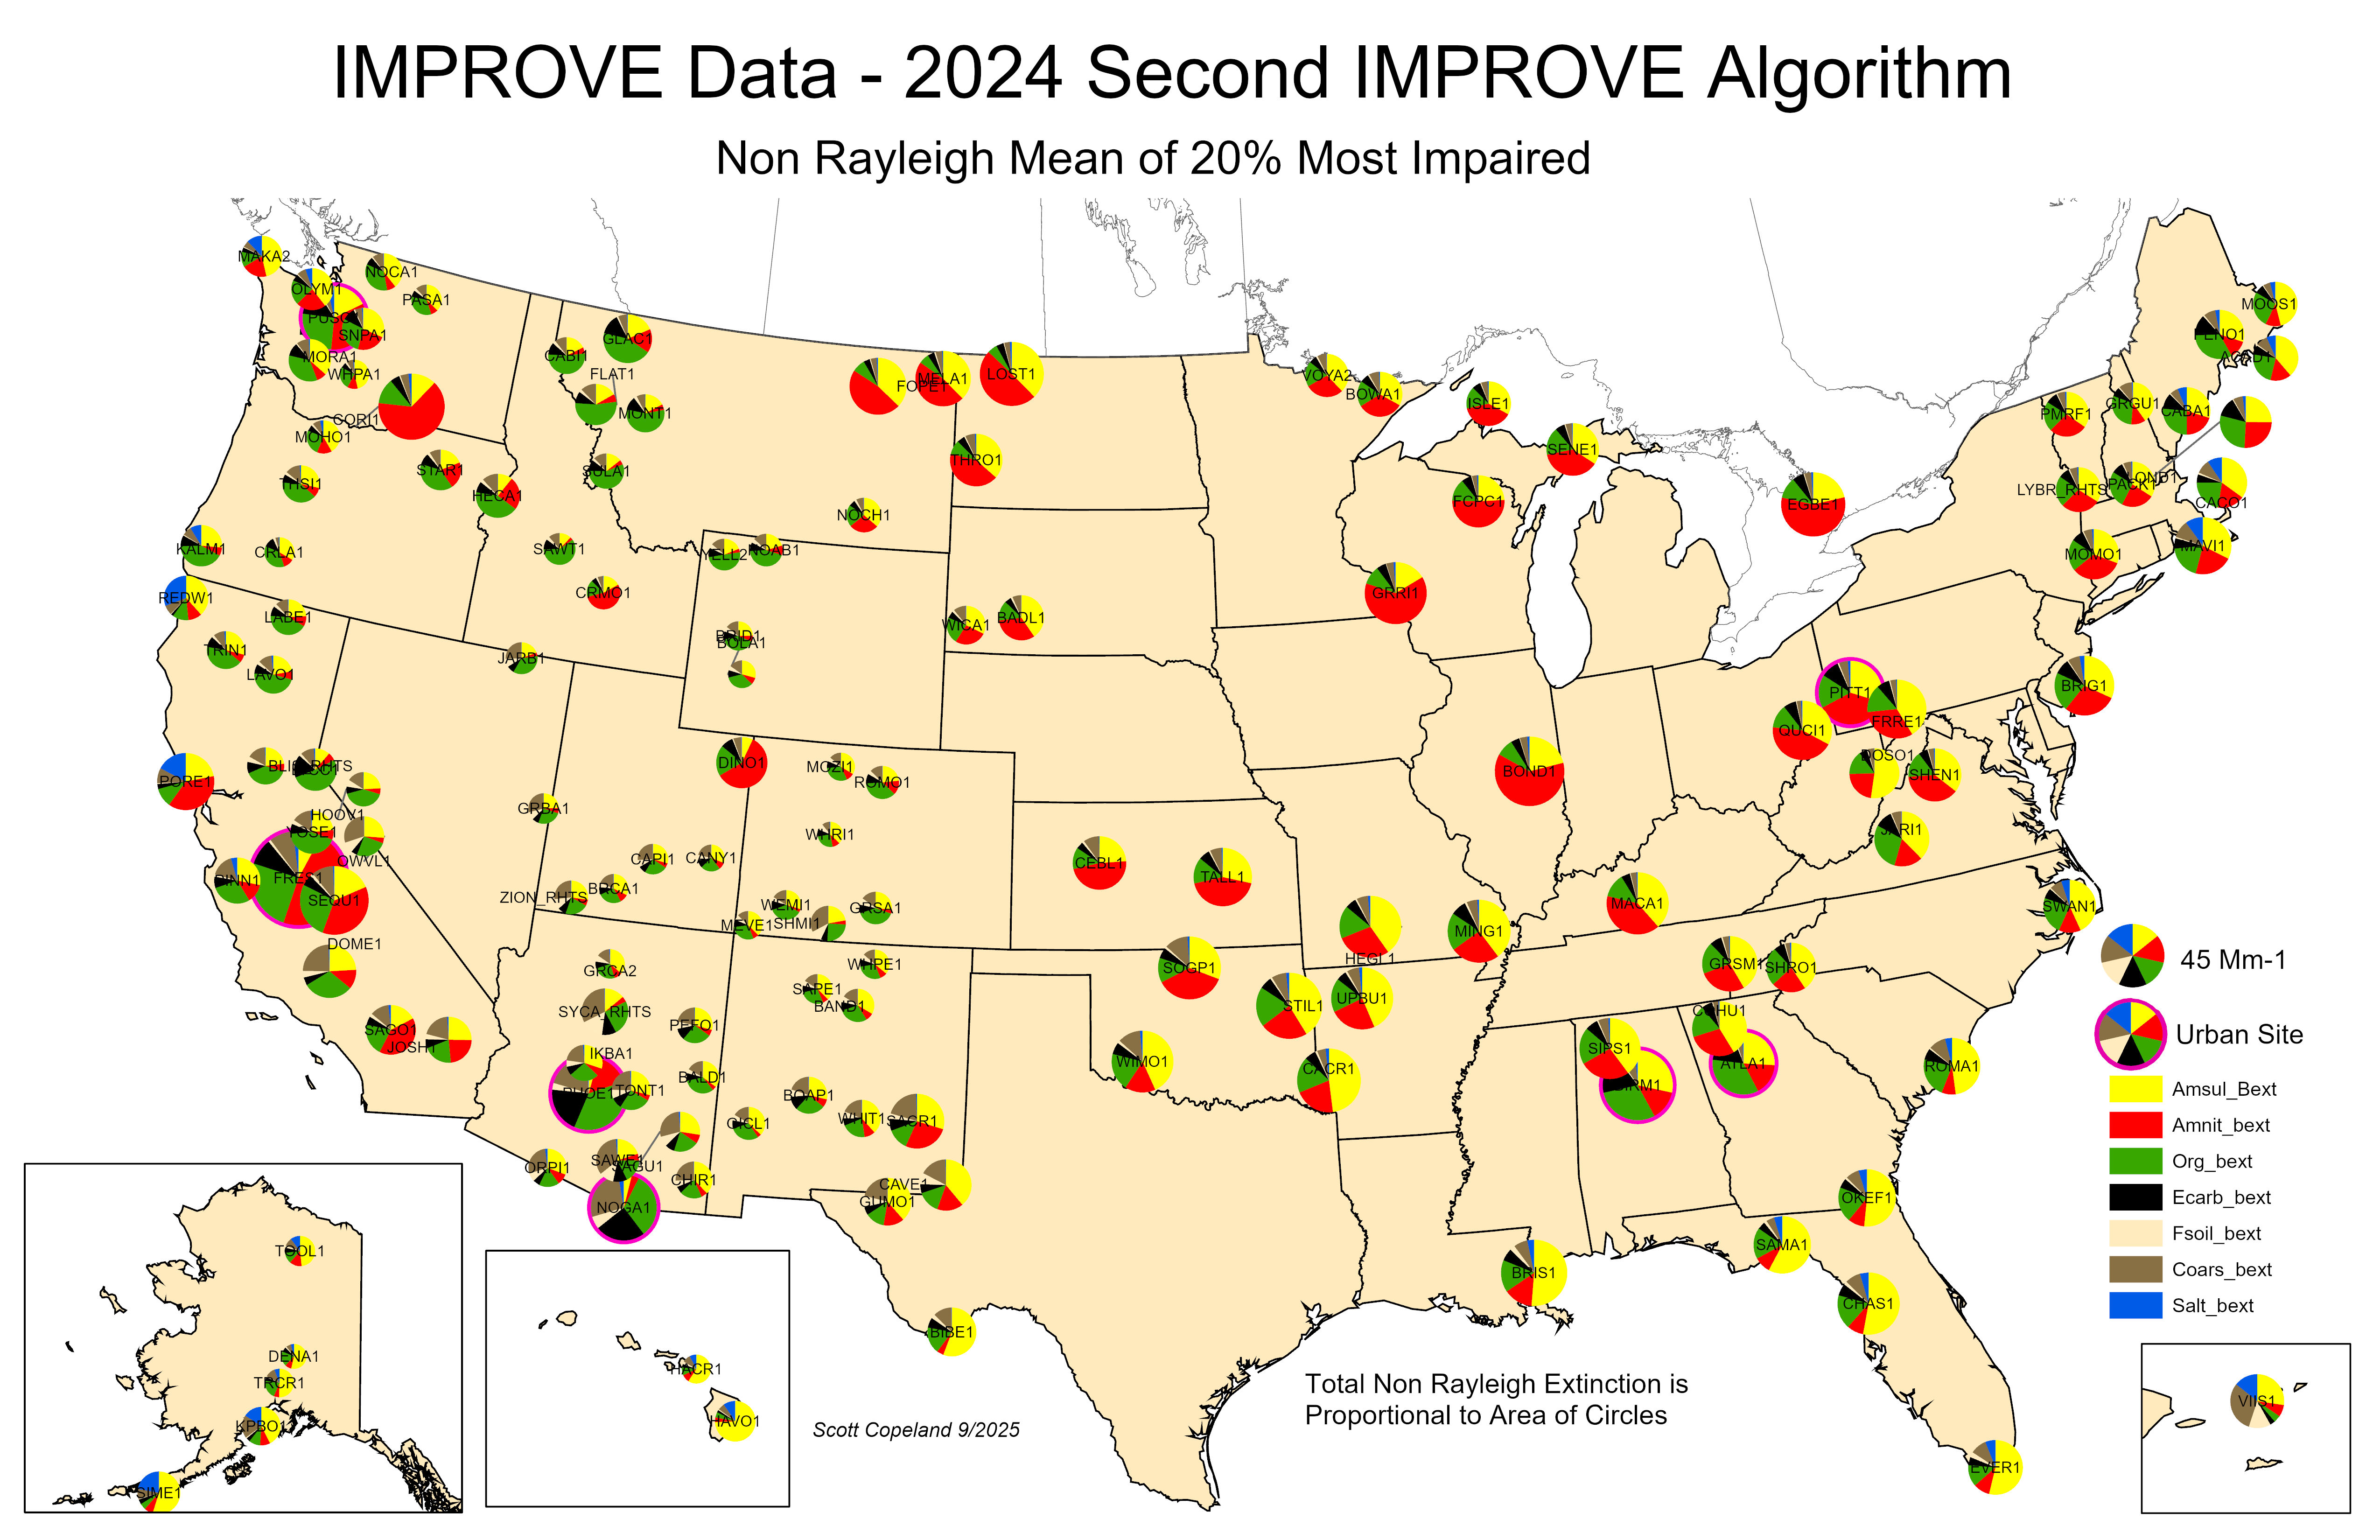
2024 Summary plots for the 20% haziest and 20% most impaired days.
ARCHIVED DATA delivered in previous years.